
Draw horizontal box plot with data series
Horizontal Boxplot
import matplotlib.pyplot as plt
data = [-12, 15, 13, -20, 19, 20, 11, 19, -11, 12, 19, 10,
12, 10, 6, 19, 3, 1, 1, 0, 4, 49, 6, 5, 3, 7,
12, 77, 9, 8, 12, 11, 11, 18, 19, 18, 19, 3, 6,
5, 6, 9, 11, 10, 18, 14, 16, 17, 17, 19, 0, 2,
0, 3, 1, 4, 6, 6, 8, 7, 7, 69, 79, 11, 11, 10,
11, 10, 13, 13, 15, 18, 20, 19, 1, 11, 8, 16,
19, 89, 17, 16, 11, 1, 110, 13, 15, 3, 8, 6, 99,
10, 15, 19, 2, 4, 5, 6, 9, 11, 10, 9, 10, 99,
15, 16, 18, 13]
fig = plt.figure(figsize=(7, 3), dpi=100)
ax = plt.subplot(2, 1,2)
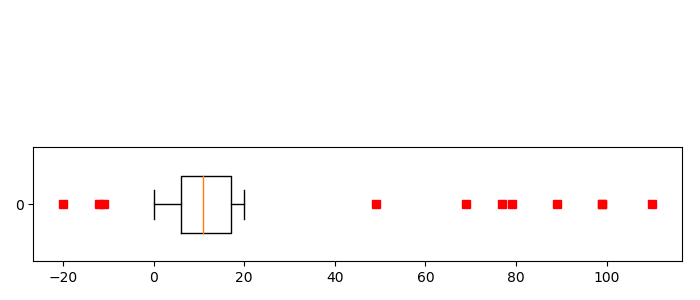
ax.boxplot(data, False, sym='rs', vert=False, whis=0.75, positions=[0], widths=[0.5])
plt.tight_layout()
plt.show()
The following is the output that will be obtained:
2018-10-29T19:02:28+05:30
2018-10-29T19:02:28+05:30
Amit Arora
Amit Arora
Python Programming Tutorial
Python
Practical Solution