
How do you change the size of figures drawn in Matplotlib?
Change the size of figures:
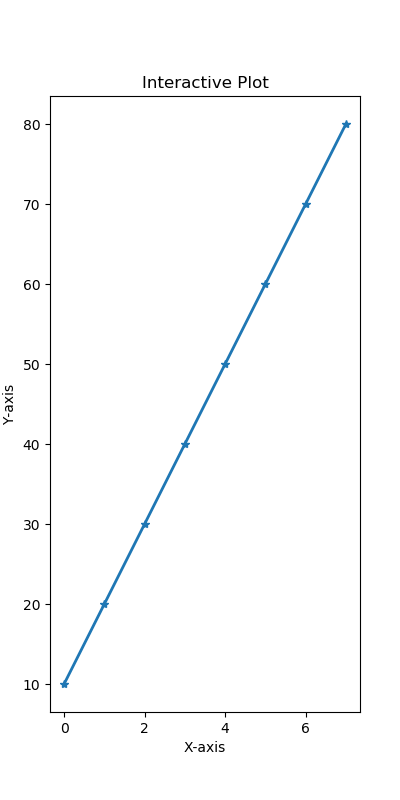
plt.rcParams["figure.figsize"] = (4, 8) will set graph figure with 400px in width and 800px in height.
import matplotlib.pyplot as plt

# Changing default values for parameters individually
plt.rc('lines', linewidth=2, linestyle='-', marker='*')

plt.rcParams["figure.figsize"] = (4, 8)

# Plot a line graph
plt.plot([10, 20, 30, 40, 50, 60, 70, 80])
# Add labels and title
plt.title("Interactive Plot")
plt.xlabel("X-axis")
plt.ylabel("Y-axis")

plt.show()
The following is the output that will be obtained:
2018-10-25T00:38:39+05:30
2018-10-25T00:38:39+05:30
Amit Arora
Amit Arora
Python Programming Tutorial
Python
Practical Solution