
How to set border for wedges in Matplotlib pie chart?
Pie chart enable border for wedges:
import matplotlib.pyplot as plt
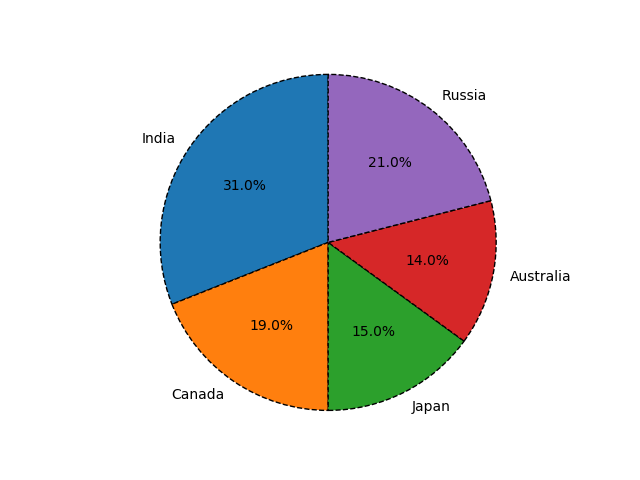
labels = ['India', 'Canada', 'Japan', 'Australia', 'Russia']
sizes = [31, 19, 15, 14, 21] # Add upto 100%
# Plot the pie chart
plt.pie(sizes, labels=labels, autopct='%1.1f%%', startangle=90,
wedgeprops={"edgecolor":"0",'linewidth': 1,
'linestyle': 'dashed', 'antialiased': True})
# Equal aspect ratio ensures that pie is drawn as a circle.
plt.axis('equal')
# Display the graph onto the screen
plt.show()
The following is the output that will be obtained:
2018-11-05T09:04:37+05:30
2018-11-05T09:04:37+05:30
Amit Arora
Amit Arora
Python Programming Tutorial
Python
Practical Solution