
Plot dashed and dotted graph with color name
Choose dash patterns and color name:
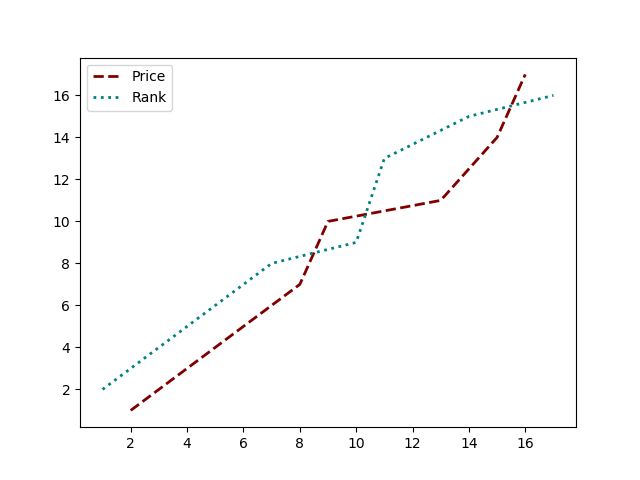
import matplotlib.pyplot as plt

x = [2, 4, 5, 8, 9, 13, 15, 16]
y = [1, 3, 4, 7, 10, 11, 14, 17]

# Plot a line graph with dashed and maroon color
plt.plot(x, y, label='Price', c='maroon', ls=('dashed'), lw=2)

# Plot a line graph with dotted and teal color
plt.plot(y, x, label='Rank', c='teal', ls=('dotted'), lw=2)

plt.legend()
plt.show()
The following is the output that will be obtained:
2018-10-27T00:37:28+05:30
2018-10-27T00:37:28+05:30
Amit Arora
Amit Arora
Python Programming Tutorial
Python
Practical Solution