
Turn on the axes of the pie chart in Python Matplotlib
Turn on the axes of the pie chart:
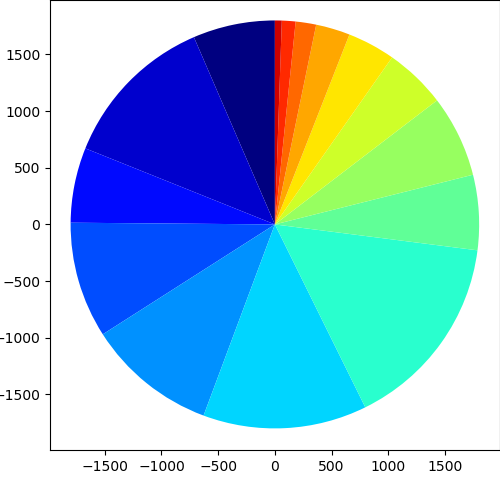
import matplotlib.pyplot as plt

sizes = [12, 23, 11, 17, 19, 24, 29, 11, 12, 9, 7, 5, 3, 2, 1]
labels = ["Market %s" % i for i in sizes]

fig1, ax1 = plt.subplots(figsize=(5, 5))
fig1.subplots_adjust(0.1, 0.1, 1, 1)

theme = plt.get_cmap('jet')
ax1.set_prop_cycle("color", [theme(1. * i / len(sizes))
                             for i in range(len(sizes))])

_, _ = ax1.pie(sizes, startangle=90, radius=1800, frame=True)

ax1.axis('equal')
plt.show()
The following is the output that will be obtained:
fig1.subplots_adjust(0.1, 0.1, 1, 1)
2018-10-27T15:04:52+05:30
2018-10-27T15:04:52+05:30
Amit Arora
Amit Arora
Python Programming Tutorial
Python
Practical Solution