
Update font appearance in line graph of Matplotlib
Adjusting text formats:
import matplotlib.pyplot as plt
fontparams = {'font.size': 12, 'font.weight':'bold',
'font.family':'arial', 'font.style':'italic'}
plt.rcParams.update(fontparams)
# Plot a line graph with specific font style
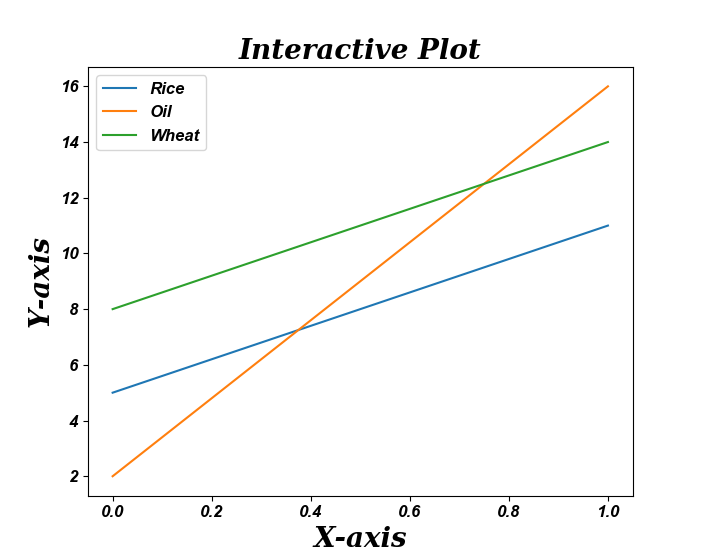
plt.plot([5, 11], label='Rice')
plt.plot([2, 16], label='Oil')
plt.plot([8, 14], label='Wheat')
labelparams = {'size': 20, 'weight':'semibold',
'family':'serif', 'style':'italic'}
# Add labels and title
plt.title("Interactive Plot", labelparams)
plt.xlabel("X-axis", labelparams)
plt.ylabel("Y-axis", labelparams)
plt.legend()
plt.show()
The following is the output that will be obtained:
2018-10-23T22:37:22+05:30
2018-10-23T22:37:22+05:30
Amit Arora
Amit Arora
Python Programming Tutorial
Python
Practical Solution