
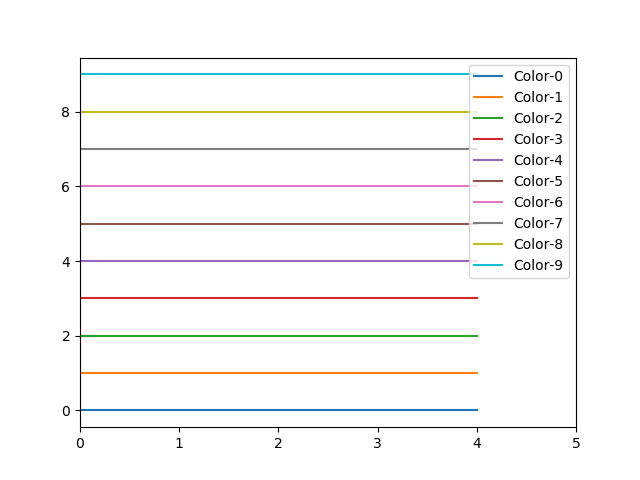
Multi line plot with each color in the default cycle
Show color cycle:
Example of a multiline plot with each color in the color cycle.
import matplotlib.pyplot as plt

for i in range(10):
    plt.plot([i]*5, c='C'+str(i), label='C'+str(i))

# Plot a line graph
plt.xlim(0, 5)

# Add legend
plt.legend()

# Display the graph on the screen
plt.show()
The following is the output that will be obtained:
2018-10-24T20:37:16+05:30
2018-10-24T20:37:16+05:30
Amit Arora
Amit Arora
Python Programming Tutorial
Python
Practical Solution