
Put the legend at various position of the plot
Put the legend at various position of the plot:
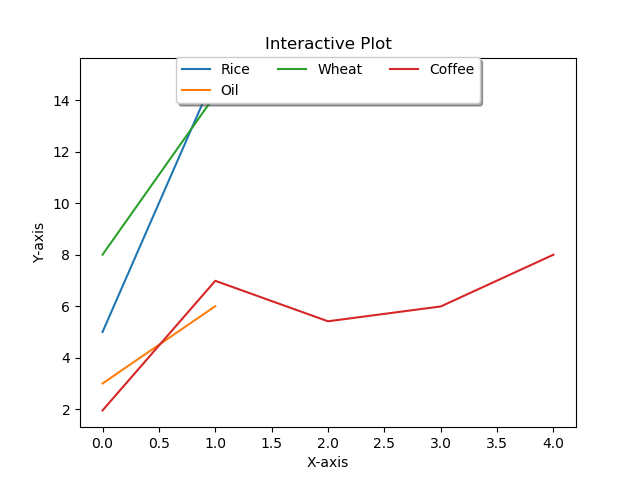
import matplotlib.pyplot as plt

#Plot a line graph
plt.plot([5, 15], label='Rice')
plt.plot([3, 6], label='Oil')
plt.plot([8.0010, 14.2], label='Wheat')
plt.plot([1.95412, 6.98547, 5.41411, 5.99, 7.9999], label='Coffee')

# Add labels and title
plt.title("Interactive Plot")
plt.xlabel("X-axis")
plt.ylabel("Y-axis")

plt.legend(bbox_to_anchor=(1.1, 1.05))

plt.show()

plt.legend(loc='upper center', bbox_to_anchor=(0.5, 1.02),
          ncol=3, fancybox=True, shadow=True)
plt.legend(loc='center left', bbox_to_anchor=(1, 0.5))

plt.legend(loc='upper center', bbox_to_anchor=(0.5, -0.05),
           fancybox=True, shadow=True, ncol=5)

2018-10-29T13:34:01+05:30
2018-10-29T13:34:01+05:30
Amit Arora
Amit Arora
Python Programming Tutorial
Python
Practical Solution